

In Part 1, we saw how relying on Excel for your enterprise analytics can hurt your business. In Part 2 of our series on Self-Service Analytics (SSA), we take a look at how SSA platforms, like Alteryx & KNIME, are helping address one of the biggest problems in analytics today: data silos.
On my recent visit to High Point Market, where I met with leaders from over 50 leading furniture organizations, many told me how legacy systems and data silos are killing critical insights into their customers, products, and business performance by stymieing data discovery.
We can thereby agree on a basic rule of thumb for business: the more quality information you have, the better your business decisions will be, and consequently, your business outcomes. Therefore, you need data integrated from across your entire organization to make the most informed decisions possible. That is why methodically eliminating data silos is essential to building a truly data-driven culture: data silos stunt business growth by failing to show the larger strategic picture at play.
But what, exactly, is a data silo?
Data Silos: What are they & how are they created?
Data silos are isolated groups of data. There are two types of data silo: functional and structural. Each has different causes, symptoms, and solutions. Functional data silos are created when functional departments hoard information, for various reasons, that make it difficult for the rest of the organization to find and access. Functional silos may occur in order to develop an internal competitive advantage, but just as often, they happen innocuously due to a lack of communication or understanding of how data could benefit the company as a whole. Destroying functional data silos is essentially an issue of corporate culture and corporate design.
Structural data silos, on-the-other-hand, are design limitations in business systems that limit their ability to “speak” with each other. The problem is compounded by the sheer number of new systems that we use every day. For instance, a typical marketing department can use upwards of 20 separate tools for their work: from social media platforms, to marketing automation software, they are inundated with Marketing Technology (Figure 1) that wasn’t designed to communicate with each other. This limits their ability to peer deeply into customers, campaign, and channel performance.
The rest of the business fares no better. For example, a common issue we address at Haystack is blending data from eCommerce platforms with Point-of-Sale systems and ERPs – three systems that don’t communicate – and analyze the blended data to reliably track sales and customer transactions. You can see a sample sales dashboard created from blended data here.
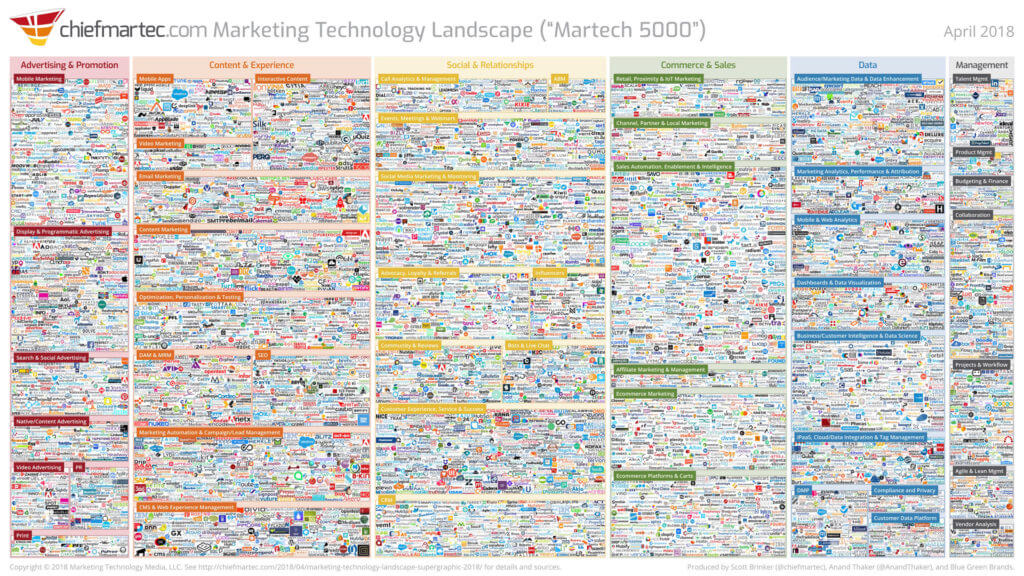
Figure1. Current MarTech landscape. www.chiefmartec.com
Even in data savvy organizations, data often goes unexplored for years due to the use of a specific web-based platform or legacy system. The platform chosen hosts all the data and interface, and while it may provide some simple analytics, it lacks depth and a connection to the rest of the organization. Fortunately most such platforms offer REST APIs to allow access to data, but many organizations lack the expertise to make good use of it.
Retrieving data from legacy systems in an automated manner can also be difficult; replacing them altogether can be prohibitively expensive. Therefore, a tool that can connect to legacy systems or web APIs, extract their data, and automatically blend it with data from other systems, can have a transformative effect on a company. You can see a sample analysis using web-based “off-premise” data here.
Key takeaway: Data silos are created by functional departments, structural business systems, and legacy systems. They all limit the flow of information in your business.
How do Data Silos hurt your business?
The most obvious way that data silos hurt your business is through the limited analytics they produce. Often called “Siloed Analytics,” it is the natural by-product of having your business analysis performed on only a partial subset of all the data that’s available. It’s the analytic equivalent of looking through a peephole versus opening the door to a full and complete understanding of your business. To really understand your products, customers, and business performance, you must leverage every morsel of data you can muster.
Data silos simply slow your business through inefficient decision-making. By reducing the quantity, quality, and credibility of your data, they effectively cause you to second-guess the validity of every decision you make. In today’s fast-paced business environment, this can cost you dearly.
Key takeaway: “Siloed Analytics” affect the quantity, quality, and credibility of your business analytics.
How SSA tools help destroy Data Silos
The first step in analytics is having consistent access to all the data you need to produce reliable metrics, models, and insights. Unfortunately, this data is rarely found in one place. How then, are you to analyze it? Do you really need major investments in IT infrastructure, like cloud-based data warehouses, to prepare all your disparate data sets for analysis?
The answer to these challenges lies in self-service analytics and data blending tools. Specifically, SSA platforms such as Alteryx and KNIME, address these issues in the following ways:
1. They help you connect to an unlimited number of data sources right where they live.
2. You don’t need advanced programming skills to get, blend, and analyze your data.
3. You no longer need a multitude of tools, processes, or scripts to get the data you want.
4. You no longer need to wait for other departments to give you the data you need.
5. They help you shift from spending 80% of your time preparing data to analyzing it instead.
Let’s look at each of these in turn.
In Situ not In Silo
Extracting and scrubbing data from multiple sources used to be a slow and tedious process. Traditional ETL (Extract Transform Load) procedures relied heavily on a delicate process to first identify the necessary data, develop complex queries and scripts to extract it, uniformly prepare (aka transform) the data, and finally, load it into yet another system for analysis and visualization. These “data pipelines” are fraught with danger because so many potential failure points exist. Now imagine if new requirements emerge, or you need access to new data? The pipeline will break.
Imagine instead, if a tool existed that would provide you, the business user or analyst, the freedom to access whatever data you needed (assuming, of course, you have rightful access to it), wherever it is? Imagine if your line-of-business staff (not expensive data scientists) could prepare and analyze data in visual workflows where you can see, at a glance, each logical step taken and business rule applied – without writing a single line of code?
Let’s look at two examples that show precisely how Alteryx (Enterprise) and KNIME (Open-Source) do just that.
Example #1
Below is a simple example in KNIME where sales data is brought onto a canvas as a CSV file, dates are properly formatted, and the output is sorted by ascending date (See Figure 2). This simple workflow can be scheduled to run as often as you’d like, and the output will consistently be the same: sales records ordered by date in ascending order.
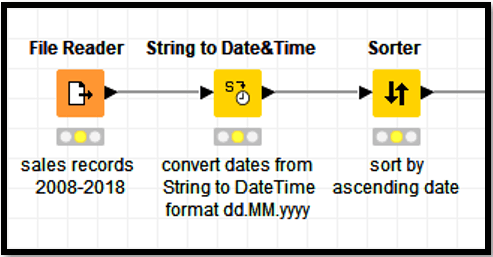
Figure 2. Simple file reader in KNIME. Dates are converted from type ‘String’ to DateTime format and sorted by ascending date.
Example #2
A slightly more complex example is shown in Figure 3 where a single workflow is used to connect to multiple databases (MS SQL, Oracle, PostgreSQL, etc.) for use in Customer Sentiment Analysis. Note how the first step is to securely pass authorized credentials to the database before data can “flow” onto the workflow for blending and analysis takes place.
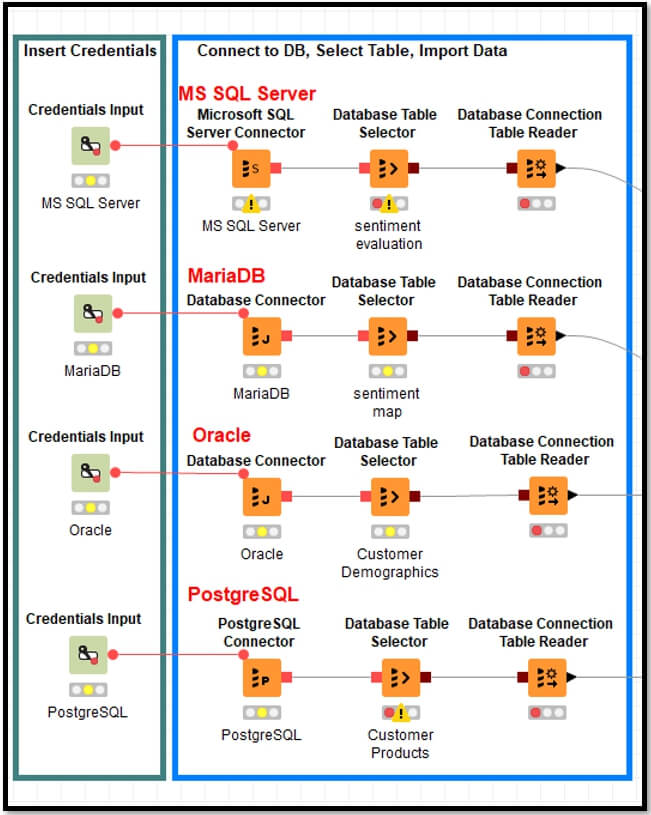
Figure 3. Four Databases and multiple data tables connected & blended simultaneously in KNIME.
Key takeaway: Blending data from multiple systems – at scale – lets companies to take advantage of insights into customer preferences, marketing performance, financial operations, site and merchandising optimization, and much more.
No Code Required
Perhaps one of the best features of SSA platforms is that they make advanced analytics possible without programming! As we saw, we were able to connect, prep, and blend four databases without writing a single line of code. Why is this important? Well, previously we had to rely on IT or skilled data scientists to code complex queries and scripts to prepare data from multiple sources and analyze it. This can lead to a “skills silo” wherein only an elite few with the necessary programming skills are able to work with data.
Now, with the help of SSA platforms, your line-of-business (LOB) staff can do it themselves, thus accelerating the speed and effectiveness of your enterprise analytics. Furthermore, it is your LOB staff –not data scientists – that understand the business requirements deeply, and know precisely what questions must be asked of the data. Their only limitation has been their inability to code and, as we have seen, that is no longer the case thanks to SSA platforms like KNIME. For example, in Figure 4 we show how to take the output from our blended databases to build a Random Forest model within the same workflow. No code required.
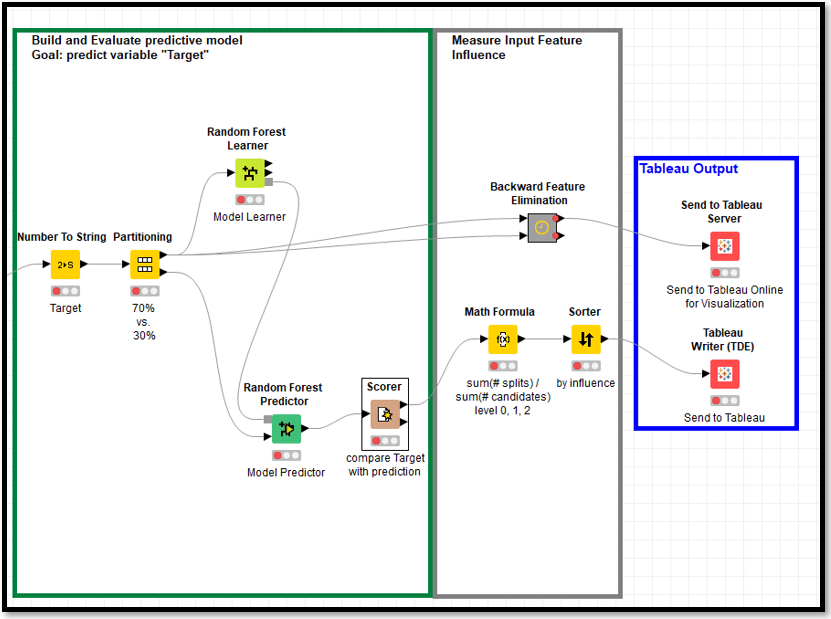
Figure 4. Output from blended databases used to build and visualize a predictive model.
Key Takeaway: The net effect of code-free analytics is that companies are able to accelerate their analytics and reduce their Time-to-Insight.
The Swiss Army Knife of Analytics
Another advantage of SSA platforms is that they can it all: ETL, analytics, and even data visualization. No longer do you need to work with myriad tools for each step in the analytics process. They level the playing field by providing everyone the tools & techniques to analyze data in every way possible. From basic descriptive statistics, to predictive analytics, and even Artificial Intelligence, SSA platforms provide everything you could ever need in a single package at low cost (or, in the case of KNIME, completely free!).

Figure 5. SSA platforms, like KNIME, are the Swiss army knives of analytics.
Key Takeaway: SSA platforms like KNIME provide all the tools you need for your Business Intelligence and advanced analytics.
The Waiting Game is Over
Unfortunately, not all departments are created equal with regards to data prioritization, leading to internal processes and systems that favor one department over another. As a result, some teams are forced to exist in a virtual “data desert.” The biggest noticeable difference you will see when you adopt a culture of self-service analytics, will be the speed and collaboration with which decisions are made. As soon as the barriers between teams are removed, the flow of information increases exponentially.
SSA platforms are used by organizations to help functional teams share their data. Thus, they help foster a culture of collaboration between cross-functional departments that will benefit the entire enterprise. By establishing baseline rules, everyone is made aware of all the available data, who manages it, and how to consistently and securely access it. No more waiting for data.
Key Takeaway: SSA tools help breed a culture of data-driven collaboration and data literacy.
More Insight, Less Prep
Over 80% of a data worker’s time is spent wrangling and scrubbing data from disparate systems and silos. This means that far more time is spent preparing data for analysis than actually analyzing it.
SSA platforms flip the formula on data prep because blending data visually is fast and intuitive. Also, the time spent in developing analytics is itself cut by 40% because there’s no need pour through thousands of lines of code. All of this will drastically reduce the Time-to-Insight (TTI) window that is crucial to business today. What used to take days or weeks to produce, can now be done in a matter of hours. Imagine what that can mean for your bottom line?
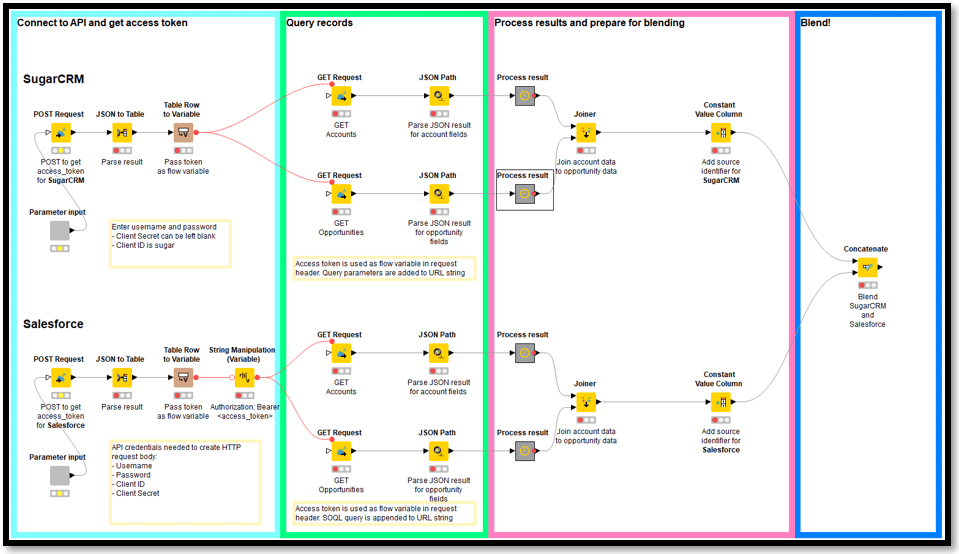
Figure 6. Blending data from two CRM systems in KNIME.
Key Takeaway: SSA platforms flip the formula on data prep, allowing you to spend more time analyzing data and less time preparing it for analysis.
The Takeaway
Whether structural or functional, data silos are an inevitable reality in modern business, but that doesn’t mean you can’t do anything about them.
Self-Service Analytics and data blending tools like KNIME help you connect to, and extract data from, the most entrenched data silos. They provide the ability to tap into data where it lives without the cost and complexity of data warehouses. SSA tools also deliver the power of advanced analytics in an intuitive drag-and-drop environment without coding. And finally, SSA platforms help you leverage the enterprise knowledge trapped within every system and segment in your organization.
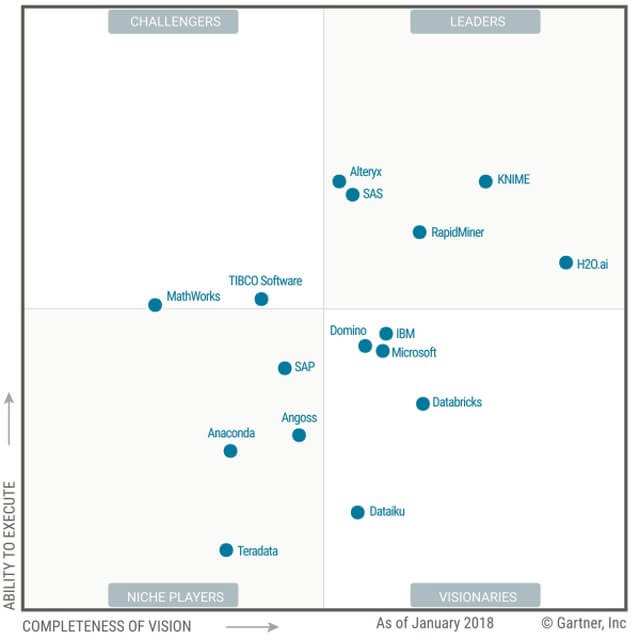
Figure 7. KNIME and Alteryx are the leading data analytics platforms according to Gartner.
The world of analytics is constantly shifting. New business systems appear everyday with their own intrinsic data architectures and definitions. It’s only logical to adopt tools that will allow you to plug in and analyze data from these sources today and tomorrow, regardless of where the analytic winds will blow. Capabilities that were prohibitively expensive for all but the biggest organizations, are today freely available in robust data blending and analytics platforms like KNIME. Working with a trusted data partner, like Haystack, will help you develop a culture of self-service analytics and data literacy that will transform your business well into the future.
In part 3 of our series, we will look at how SSA tools help you unlock metrics hidden in your data. Stay tuned!
About the Author:
Pedro A. Medina, E.E. lives at the intersection of advanced analytics, business and social responsibility. He inspires a new breed of innovative Data Scientists at Haystack Data Solutions. Connect with him on LinkedIn: www.linkedin.com/in/pedroalexandermedina
Need Help with Your Data?
If you have a question, thought or concern about your analytics, you can schedule a free 1-hour consultation by clicking here. We’d love to hear from you.
Share the Love
If you enjoyed this post, please leave a comment below and share on your social networks. That would help tremendously in getting the word out and raising the visibility of the blog.
