

Data is core to digital transformation. Modern technology, eCommerce, and analytics are driving major changes in how businesses are investing and making decisions. Threats from digital-native competitors, shifting consumer habits, and globalization have converged to pressure industry like never before. Successful businesses will be those who stay ahead of this fast-changing landscape by using technology as a sales engine while embracing a data-driven culture.
On my recent visit to High Point Market, I met with leaders from over 50 leading furniture organizations. They confirmed that very few were using data as a growth driver. In fact, I heard some variant of the following from almost everyone I met:
- Many lamented still being stuck in “Excel Hell” using spreadsheets to manually prepare brittle reports that take weeks to develop and update using tedious formulas and tweaks.
- Many told me how legacy systems and data silos are killing critical insights into their customers, products, and business performance.
- Many mentioned how hard it can be to answer even basic questions about their customers such as, “How much is this customer going to spend with us throughout their lifetime?” (Lifetime Value) or “how much is it going to cost me to acquire them?” (Customer Acquisition Cost)
- Others decried how hard it is to attract, and retain, technical talent or find advanced skillsets in-house.
Most of these leaders continue to believe that only the biggest players with the most resources can extract value from data. Yet, whether you’re big or small – or whether your data is big or small – modern Self-Service Analytics (SSA) and data blending tools allow organizations of every size to leverage all their data to achieve their objectives, quickly and cost-effectively.
In this four-part series, we will look at each pain point in turn. We will look at the leading SSA platform, Alteryx, and demonstrate how it makes tedious data blending and complex analytics fast and easy without the need to write a single line of code. We will show how this new breed of visual drag-and-drop analytics platform can help organizations scale their analytics by empowering everyone in the company – not just Data Scientists – with the ability to explore, experiment, and explain answers critical to the enterprise.
But first, one of the key transitions needed in the evolution of analytics is migrating away from manual reporting processes and toward reproducible reports. This first post will dive deeply into the challenges posed by relying too heavily on spreadsheet programs like Microsoft Excel for enterprise-wide analytics and show how businesses can adopt SSA to handle everything from data preparation, to advanced statistical, geo-spatial, and predictive analytics.
Excel Hell
Though ubiquitous, Excel was not made for modern analytics. It may be great for financial calculations, ad hoc analysis, or creating charts for presentations, but it was not built for automated analytics at scale. It’s lack of transparency, repeatability, and inability to blend multiple data sources (without relying on complex VBA scripts and macros) makes it ill-equipped as a platform for supporting an organization’s Business Intelligence and analytics initiatives.
More importantly, Excel lacks the capacity for advanced statistical, predictive, or spatial analytics (clunky add-ons notwithstanding). These capabilities are the hallmarks of a truly data-driven organization and are essential for operations looking to, for instance, decide where to open a new store, anticipate customer demand, or extract profound product insights from their data.
Let’s explore how these challenges with Excel conspire to keep businesses perpetually stuck in “Excel Hell.” Specifically, we will look at the five major limitations of Excel:
- Transparency
- Repeatability
- Automation
- Scaleability
- Advanced Analytics
Transparency
No one trusts your spreadsheet results. Period. Rows and columns will inevitably hide the finer details in any analysis. Because you’re looking at raw data all at once, Excel makes it hard for users to track changes or understand context when working with a spreadsheet. This results in a lack of transparency, which results in a lack of trust in your data. How often have we stared at a spreadsheet or pivot table without any idea where the data came from, when the data was pulled, or what logical steps or business rules were applied to arrive at the conclusions?
The time-honored act of manually copying and pasting data between spreadsheets can lead to errors that can go unchecked. In fact, various studies estimate that 90% of corporate spreadsheets contain material errors. The pervasive use of ‘copy/paste’ is also a key contributor to inefficiency.

Figure 1. Frustrating data prep in Excel
What is needed is a new paradigm: a shift away from spreadsheets, and toward a modern, intuitive way of working with data. Enter the visual workflow. Its advantages are many:
- Visual workflows help translate steps previously hidden in Excel into a simple flow-chart using an easy drag-and-drop interface anyone can use.
- Workflows help users contextualize analytics by seeing the flow of data from source to insight in a single canvas.
- Workflows are self-documenting which helps validate the business rules and logic applied at each step of the analysis.
- The repeatable nature of workflows helps preserve an historical record of your data and minimize errors.
- Workflows are much easier to maintain or modify versus updating brittle spreadsheets.
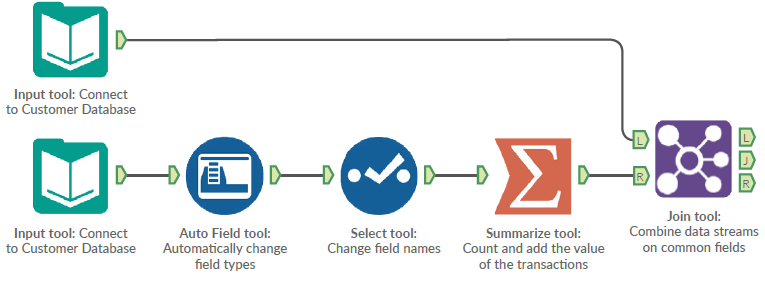
Figure 2. Intuitive visual workflow in Alteryx
Key takeaway: Businesses must trust their data. Modern SSA platforms provide much needed transparency through intuitive, visual workflows that accelerate Time-to-Insight in order to keep pace with ever-changing customer buying habits and market trends.
Repeatability
Structuring data in Excel is tedious and time consuming. An Excel user’s job involves repeatedly preparing updated data in the same format to produce the same reports. According to IDC, spreadsheet users spend, on average, 8 hours per week duplicating efforts to update reports. This translates into $12,000 per analyst wasted maintaining spreadsheets every year. This is time better spent actually analyzing the data for the business.
For example, I spoke with the VP of Sales for a national furniture manufacturer who sends 16 individual spreadsheets as an email attachment to his regional sales managers. He then waits for their updated data and then manually extracts and rolls it up for a quarterly sales report for executive management. Certainly, this person’s time is better spent engaged in other activities!
Lack of data governance poses another challenge for ensuring consistency in analytics. Because anyone can create local copies for ad hoc analysis, you can find yourself inundated with multiple versions of a spreadsheet: the classic “dueling spreadsheets” scenario. Even with new file management capabilities on cloud-hosted versions of Excel, individual users can extract data differently and at different times, each time creating a new snapshot of the business.
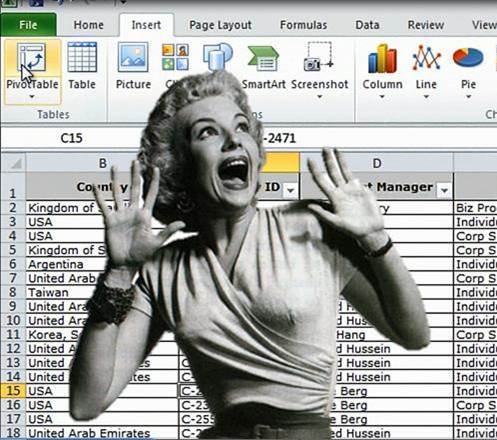
Figure 3. Run away from Excel Hell!
Today’s self-service data preparation software allows for the repeat and reuse of standardized analytics. Workflows are built once and run repeatedly. This ensures timely, accurate, and consistent data for a thorough analysis.
Key takeaway: Today’s business operations are complex with many customer touchpoints, product SKUs, & business divisions. Consistent, repeatable workflows help standardize analytics throughout the organization and reduce Time-to-Insight by 40% or more. Imagine what you can do with the extra time!
Automation
Agile organizations capable of responding to capricious consumer demands, fickle fashion trends, and constant competitive pressures need insights FAST. Automation of enterprise analytics is essential for achieving agility and a competitive edge.
Excel has limited automation capabilities. It requires tedious programming in Visual Basic and putting macros in front of spreadsheets to achieve even a basic level of automation. But tying macros, scripts, and formulas together is a nightmare when it’s time to update or modify a report. Furthermore, these skills are beyond the capabilities of most end users. Consequently, your line-of-business (LOB) staff must continue to rely on IT for these solutions which invariably leads to the IT bottlenecks we’ve all experienced. This is the opposite of agility.
By contrast, modern SSA platforms like Alteryx, make it easy to automate your analytics. Workflows can be scheduled to run at specific times or intervals. They may even be event-triggered whereby a process is automatically run when a given event, say a sales transaction, occurs. This has the advantage of ensuring that all data remain current and that reports, analytic models, and dashboards are kept updated across the organization.
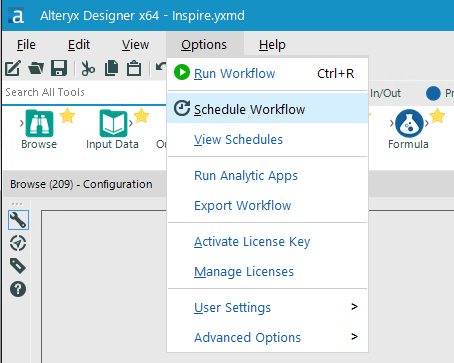
Figure 4. Alteryx scheduler helps automate analytics
For example, Haystack helped a national furniture chain automate corporate sales reports across all sales channels. Using Alteryx, we developed an automated workflow that pulled sales data from their eCommerce platform, pulled transactional data from their ERP, and combined it with data from their Point of Sales (POS) system. This workflow not only blended disparate datasets, but applied all the analytics on a single canvas. Finally, the combined output data was pushed to a shared executive-level dashboard. This process was completely automated, ensuring that the business continually sees accurate, up-to-the-minute sales data.
Key takeaway: Organizations must automate their analytics and business intelligence with modern data blending tools. Automation means faster insights allowing you to compete with an analytics edge.
Scaleability
What originally started with a single source of data for analysis in Excel, has evolved into a need to integrate ever larger volumes of data from ERPs, CRMs, eCommerce platforms, marketing automation software, social media, and many other sources. The ability to blend multiple data sources and formats at scale is essential to gain a full view of your customer, product, and business performance.
Using our earlier example, to attribute sales to a particular customer and discover that the person who purchased in your store is, in fact, the same person who purchased online, you must consolidate sales across channels and match attributes from two very diverse data sources. This requires a new breed of tools purpose-built for the task.
Excel’s lack of performance when utilizing large amounts of data or running complex formulas, makes it unsuitable for use in large scale data blending. Connecting to multiple systems simultaneously again requires complex scripts and manual connections. Additionally, Excel’s limitations on the number of rows and columns allowed within a single spreadsheet means that big data analytics aren’t even possible.
Unlike Excel, Alteryx has no limitation on either data size or format. Because SSA platforms allow you to blend all your data sources onto a single workflow, they are optimized to run complex calculations with impressive speed. Have you ever tried running a VLOOKUP on a spreadsheet containing more than a few thousand rows? Painful indeed.
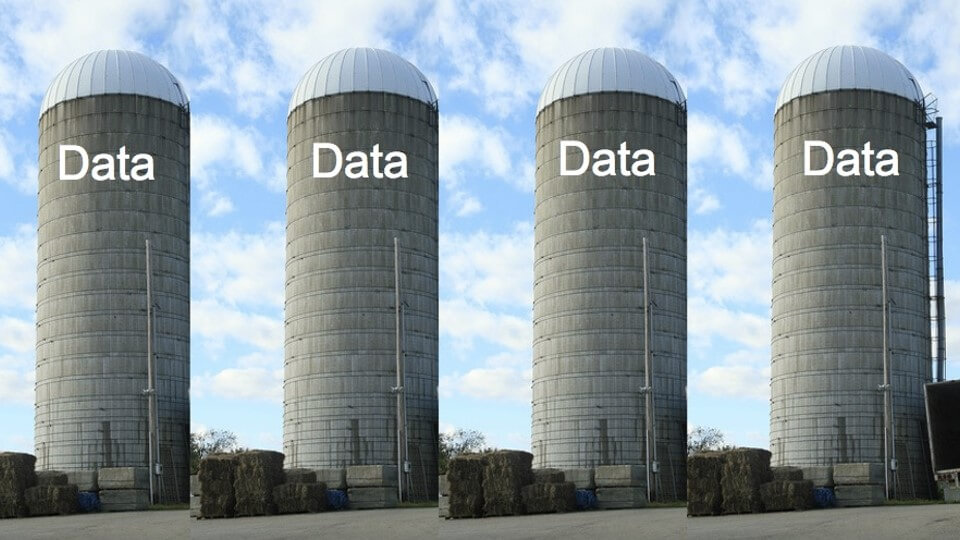
Figure 5. Data Silos increase the volume and complexity of data
Key takeaway: Blending data from multiple systems – at scale – lets companies to take advantage of insights into customer preferences, marketing performance, financial operations, site and merchandising optimization, and much more.
Advanced Analytics
Perhaps one of the key advantages found in SSA platforms is how they enable building advanced analytics with clicks, not code. Previously, advanced modeling, such as predictive and geo-spatial analytics, required trained experts who worked in statistical computer languages like R or Python. Today, SSA platforms provide a code-free environment with pre-built tools that allow experienced analysts the ability to develop advanced algorithms that were previously the domain of Data Scientists and statisticians. Imagine the transformational effect on your organization when you empower everyone with advanced analytics capabilities?
For instance, you could better predict customer behavior and calculate their likelihood to respond to particular campaigns, promotions, or products. Consistency in inventory management, anticipating demand trends, and replenishing stock using more accurate order data, enables retailers to increase turns and carry less inventory.
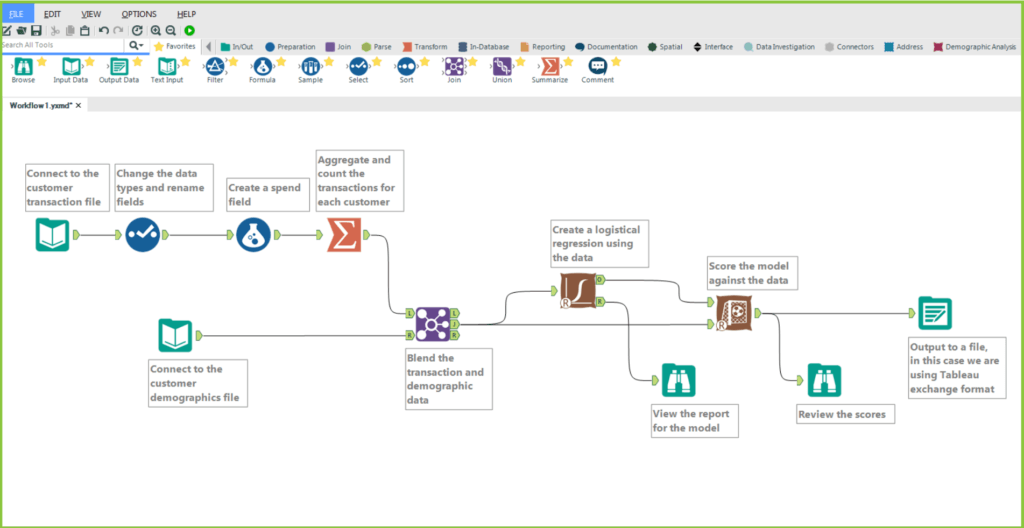
Figure 6. Predictive logistic regression workflow in Alteryx
It’s no longer a matter of collecting information. The emphasis now is on analyzing this data flow and making educated decisions about the future.
Another area where advanced analytics plays an important role is geo-spatial analytics. Recently, a retailer wanted to understand where their customers and store locations fell on a map relative to each other, calculate drive times, and learn other geographic properties. Additionally, they needed help choosing the best locations for their next store and distribution center. Using Alteryx’s spatial tools, Haystack was able to deliver deep spatial analysis quickly and easily. Using Excel with the Mapinfo add-on, this would have taken hours or days to produce. Using an SSA platform like Alteryx, it took only minutes.
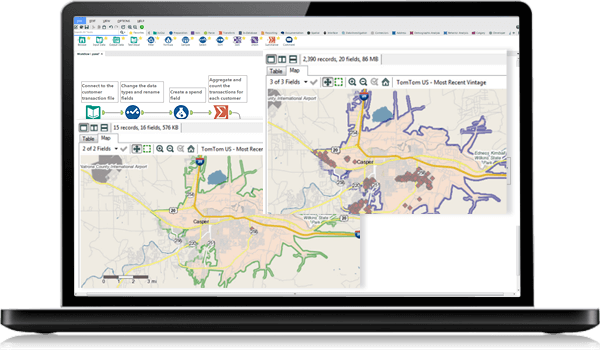
Figure 7. Geo-spatial analytics in Alteryx
Key Takeaway: The net effect of advanced analytics is that companies become more proactive instead of reactive to consumer demands and market fluctuations; you gain quantitative value simply by being able to gather and analyze historical data to drive future growth.
The Takeaway
We are living in a digital economy and its currency is data. As we have seen, industries are feeling pressure from today’s digital dynamics. Traditional top-down approaches to Information Technology are unable to keep up with the pace of modern business and are a bottleneck in a world where speed and Time-to-Insight are a competitive advantage. If businesses are to remain relevant, they must embrace a data-driven culture of innovation and exploration.
It’s clear, then, that legacy data analysis tools, such as Excel, are prohibitively time consuming and ineffective. What’s needed are solutions that are automated, repeatable, transparent, easy to use, and scalable enough to process the enormous volumes of data companies now draw from multiple sources, while unlocking advanced techniques like predictive and spatial analytics.
Self-Service Analytics and data blending tools pick up where legacy tools left off. They deliver on the promise of truly democratizing analytics across an organization by putting data preparation and analysis into the hands of business users, where analytic outcomes are best understood and applied. Using Self-Service Analytics, organizations can now resist digital disruption and purge themselves from the purgatory of ‘Excel Hell.’
About the Author: Pedro A. Medina, E.E. lives at the intersection of advanced analytics, business and social responsibility. He inspires a new breed of innovative Data Scientists at Haystack Data Solutions. Connect with him on LinkedIn: www.linkedin.com/in/pedroalexandermedina
Need Help with Your Data?
If you have a question, thought or concern about your analytics, you can schedule a free 1-hour consultation by clicking here. We’d love to hear from you.
Share the Love
If you enjoyed this post, please leave a comment below and share on your social networks. That would help tremendously in getting the word out and raising the visibility of the blog.
