
Time Series Demand Forecasting for Food Manufacturing
Photo by Patrick Fore on Unsplash
Why a series on Time Series Demand Forecasting for Food Manufacturers?
As we covered in our previous post, there is an urgent need for food manufacturers to improve their business processes because of the labor, supply-chain, and inflation challenges they face. With the upcoming IBIE Baking Expo, and on the heels of a successful forecasting project for a commercial baker, we will walk through the steps taken to address these challenges by building demand forecasts using free, open-source tools like the KNIME no-code analytics platform and the R statistical programming language to demonstrate how easily food manufacturers – like commercial bakers – can build their own demand forecasting solutions.
Commercial bakeries offer the perfect use case for accurate demand forecasting in food manufacturing because of the perishable nature of their baked goods. However, demand forecasting can bring many benefits to all food manufacturers.

Benefits of Demand Forecasting for Food Production:
- Improved scheduling of production, transportation and personnel.
- Better prediction of cash flows.
- More control of operating costs.
- Precise product pricing.
- Improved order fulfillment & turnaround.
- Significant savings on packaging costs (packaging is SKU-dependent for most baked goods).
- More successful product launches.
- Reductions in safety stock by 10-20%.
As the first step in strategic planning, demand forecasting also plays a critical role in controlling high input costs, supply shocks, and labor shortages being faced by most food manufacturers today.
Demand Forecasting Ambitions & Expectations
Our hope is that you will learn how to build your own demand forecasting models by following along with our series. You will only need a basic understanding of statistics and a willingness to learn rudimentary computer programming skills.
With the help of drag-and-drop, no-code analytics platforms like KNIME, we will show how easily you can build robust forecasting solutions with little programming. However, in-depth explorations of advanced modeling and forecasting concepts will be done using R and the free RStudio editor. Finally, we will show how these platforms integrate seamlessly together to allow for “code-free” and “code-friendly” development of powerful data solutions.
Forecasts vs. Plans vs. Goals

The first step is understanding the differences between forecasting, planning, and goal setting for food manufacturers like commercial bakers.
Forecasting is the art and science of predicting future events as accurately as possible. Quantitative forecasting in food production applies mathematical techniques to historical data to capture patterns that exist in the data in order to improve production and reduce costs. Qualitative forecasts use prior experience and personal judgement to (hopefully) accomplish the same aim.
Goals are what the operator wishes to accomplish, whether they are sales targets, waste and scrap targets, or throughput quantities. Too often, food manufacturers have goals that are not tied to any forecasts, thus leading to uncertainty over whether they can be realistically met.
Plans are what tie forecasts and goals together. For instance, production plans based on realistic goals and solid forecasts are likely to result in better yields, less safety stock, and less spoilage of baked goods.
The next step is determining what to forecast.
As long as you have enough data, nearly anything can be forecasted. But to keep things simple, if we focus only on production volumes, sales volumes, and/or transactions over time, we are still left with many things to consider. For instance,
- Do you want to forecast every product, all products combined, or specific product categories?
- Do you want to forecast sales for every customer, every sales region, or just total sales?
The answers to these questions can greatly affect your choice of model and its effectiveness.
Time Horizons & Frequency
Next, what is your forecasting time horizon and forecasting frequency?
Short-term forecasts are useful, for example, when scheduling of short production runs, scheduling plant personnel, or product shipping.
Medium-term forecasts can be used for purchasing input materials (e.g. baking flour, eggs, etc.), planning inventory, or purchasing machinery and equipment for the plant.
Long-term forecasts are used to make key strategic decisions such as capital expenditures, market expansions, or deciding whether to launch a new food product.
Keep in mind that the longer the time horizon, the less accurate the model may be.
Also, how often a forecast is needed is also important. Frequent forecasts (Daily/weekly) are best suited for automation. Infrequent forecasts can allow for manual updates to account for unexpected changes (e.g. a competitor’s promotion).
Time Series vs. Explanatory Models
Lastly, you’ll want to decide whether you need a time series model versus a explanatory model.
Time series models will only look at historical values of the variable you want to forecast, whereas explanatory models incorporate data from other variables to help predict and explain the target’s behavior.
There are many reasons why you may pick one model over the other. First, the choice may depend on the data available. For instance, explanatory models require more data than time series models that may make them harder to build and maintain. For example, you may not have consistent access to timely weather data, location data, and/or buyer data to help explain why certain baked goods sell more than others.
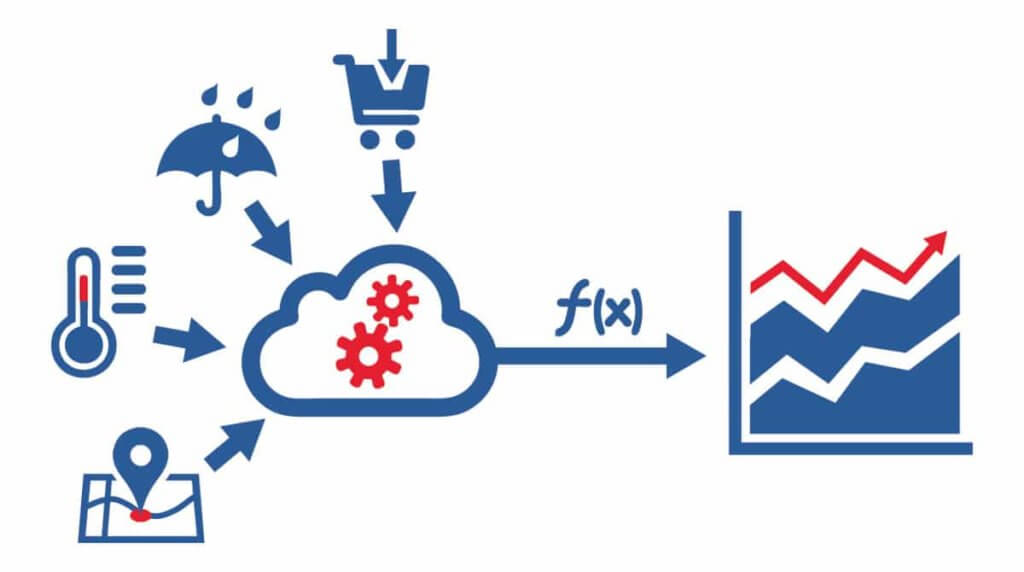
If you only want to predict what will happen with the best possible accuracy, a time series model is often the best option. For this reason, we will focus on time series forecasting during the first half of this series.
Basic steps in building Demand Forecasts for food manufacturers
Finally, two must-haves in forecasting are having strong organizational support and the expertise to identify suitable forecasting problems, select appropriate models for each, and ultimately develop a forecasting system to help predict uncertain events by extrapolating patterns in your data. These actions, when taken together, will help move your commercial bakery towards becoming a more data-driven operation.
With these key considerations out of the way, and the problem clearly defined, we’ll look next at the overarching steps required to build demand forecasts for our hypothetical commercial baker. We will consider each step in future posts, but for now it is good to understand the primary steps necessary in building time series models.
Step 1. Gather the data
Once you’ve defined the problem and identified the data sources as indicated previously, you will want to create a repeatable process (or data “pipeline”) to connect and extract the necessary data for your model. Nowadays, your data may live in many different places such as on-premises databases, cloud-based databases, ERPs, MRPs, WMSs, or 3rd party SaaS platforms (e.g. Salesforce.com).
For our next post, we will walk through the process for installing KNIME and RStudio and show how to easily connect to data regardless of where it lives.
Step 2. Exploratory analysis & data visualization
Now that you have your data accessible in an automated and repeatable “pipeline,” the next step is to explore and visualize your data. This is often done with the use of summary statistics and graphical analysis. During this step, you are looking for general patterns in your data, missing values, outliers, etc.
During this exploratory phase, you will often learn things about your business, clients, and products that you never knew before. Consequently, you should not gloss over this crucial step in the modeling process as it can yield insights beyond just building your forecast model.
Step 3. Choose and fit the model(s)
The model you choose may depend on the availability and quality of your data, and how you intend to use your model. During this step, it is common to build three or more models to compare their performance against one another, or to combine the models (i.e. ensemble models) to yield even better results.
Step 4. Evaluate the model’s effectiveness
It is important to design a series of experiments before, during, and after deploying your model to see how well the model performs using real-world data. Additionally, you’ll want to gather data for the forecast period once it becomes available in order to compare expected and forecasted values.
As is often the case, the lessons learned during this phase will help you incorporate your new insights into future iterations of your model. This iterative process is to be expected and can result in greater accuracy for, confidence in, and adoption of your models.
The Takeaway
Now that you know the key steps and considerations for time series demand forecasting in food production, stay tuned for our next post where we will walk through the data gathering phase of time series modeling.
Need Help Modernizing Your Data Analytics or Process Automation?
If you have a question about how modernizing your analytics and process automation could help accelerate your food operation, please schedule a free 1-hour consultation by clicking here. We’d love to hear from you.
Share the Love
If you enjoyed this post, please leave a comment below, share on your social networks, or share it with a colleague who can benefit from it.
➼ Are you going to IBIE?
➼ Let’s connect!
